Loading
Loading
Raw PLC binary data from 250+ machines → real-time dashboards and shift reports. Connect directly to your factory's PLCs and SCADA systems to collect, decode, and visualise every machine's performance — accessible from any browser.
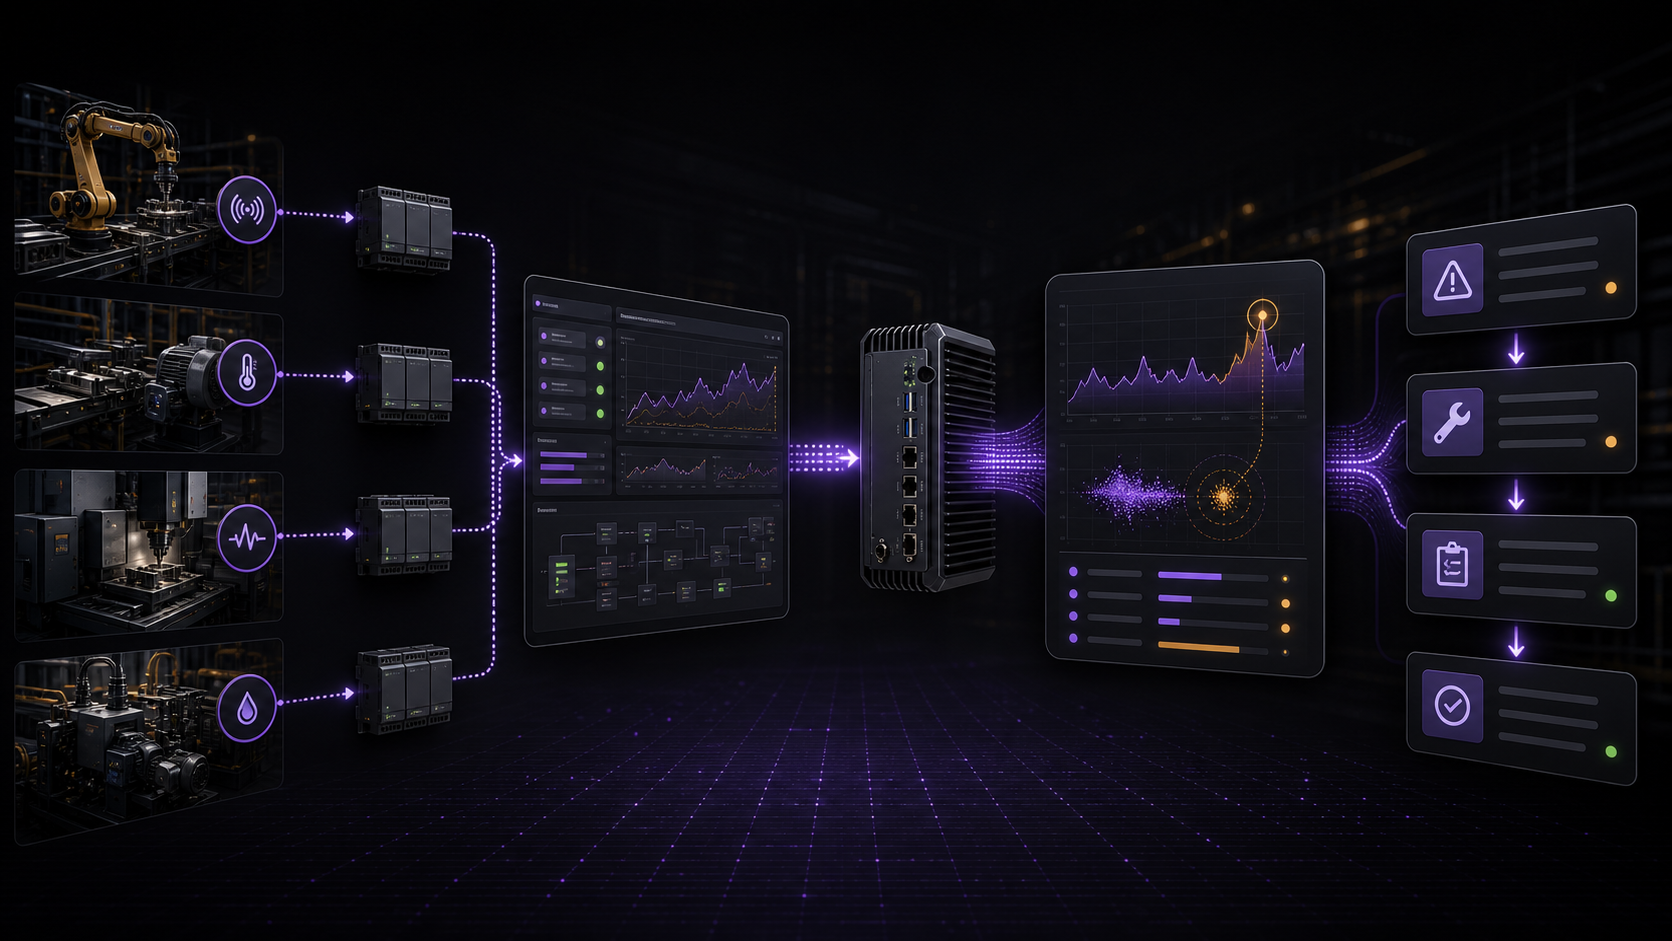
Connect directly to your factory's PLCs and SCADA systems to collect raw binary/hex data streams from all 250+ machines simultaneously. The system decodes data, normalises values, detects anomalies in real time, and presents everything as live line graphs, bar charts, OEE dashboards, and automated shift reports.
Built on Python with OPC-UA and Modbus protocol support, InfluxDB for time-series storage, and Grafana for visualisation — this is industrial-grade production monitoring that scales horizontally across your entire factory floor.
250+ Machines
Real-Time Monitoring
Six core capabilities that take you from raw PLC binary streams to boardroom-ready production insights.
Connect to any PLC — Siemens, Allen-Bradley, Mitsubishi, Omron — via OPC-UA, Modbus TCP/RTU, or proprietary protocols. Universal machine connectivity out of the box.
Collect and decode binary/hex data streams from 250+ machines simultaneously with sub-second latency. No data gaps, no delays, no blind spots on your factory floor.
AI-powered anomaly detection flags machine deviations, temperature spikes, vibration changes, and production stops in real-time — before they become costly breakdowns.
Live Overall Equipment Effectiveness dashboards — availability, performance, quality — for every machine, line, and shift. Spot bottlenecks instantly and benchmark across lines.
Auto-generated shift, daily, and weekly reports with production counts, downtime analysis, and OEE trends — delivered to managers automatically via email or WhatsApp.
Access live dashboards and historical data from any browser — mobile, tablet, or desktop — no software installation required. Check your factory from anywhere in the world.
Built with proven industrial protocols and modern data infrastructure for reliability at factory scale.
Stop guessing what's happening on your factory floor. Know exactly what every machine is doing, right now.
See every machine's status, output, and performance in real-time — no more walking the floor to find out what's running and what's down.
AI anomaly detection flags deviations in real-time — address problems during early warning signs, not after a full breakdown.
Track availability, performance, and quality metrics over time — identify exactly which levers to pull to improve overall equipment effectiveness.
Shift, daily, and weekly reports are generated and delivered automatically — managers get insights without spending hours compiling spreadsheets.
A clear four-step process to bring your entire factory floor online with real-time data visibility.
Establish OPC-UA/Modbus connections to all machines — configure data point mapping for every register, sensor, and output across your factory.
Raw binary data is collected, decoded, and normalised in real-time — every machine's data stream is parsed and stored with sub-second latency.
Live dashboards show machine status, OEE, and production metrics — anomalies trigger instant alerts via SMS, email, or WhatsApp to the right people.
Automated shift reports generated and delivered — historical trends analysed for continuous improvement and long-term OEE optimisation.
Siemens, Allen-Bradley, Mitsubishi, Omron, Schneider, and any PLC with OPC-UA or Modbus TCP/RTU support — we also handle proprietary protocols with custom adapters.
250+ machines monitored simultaneously in production. The architecture scales horizontally — add more machines without performance degradation.
Yes. All dashboards are browser-based and responsive — access live data and reports from any mobile, tablet, or desktop device with no app installation required.
Yes. InfluxDB time-series database stores years of production data — query any time period for trend analysis, comparison, and root-cause investigation.
Absolutely. Configure alerts for machine stops, temperature thresholds, OEE drops, and anomaly detection — delivered via SMS, email, or WhatsApp instantly.
Let's connect your PLCs, stream your data, and give you real-time visibility across every machine — book a consultation to scope your factory's automation.