Loading
Loading
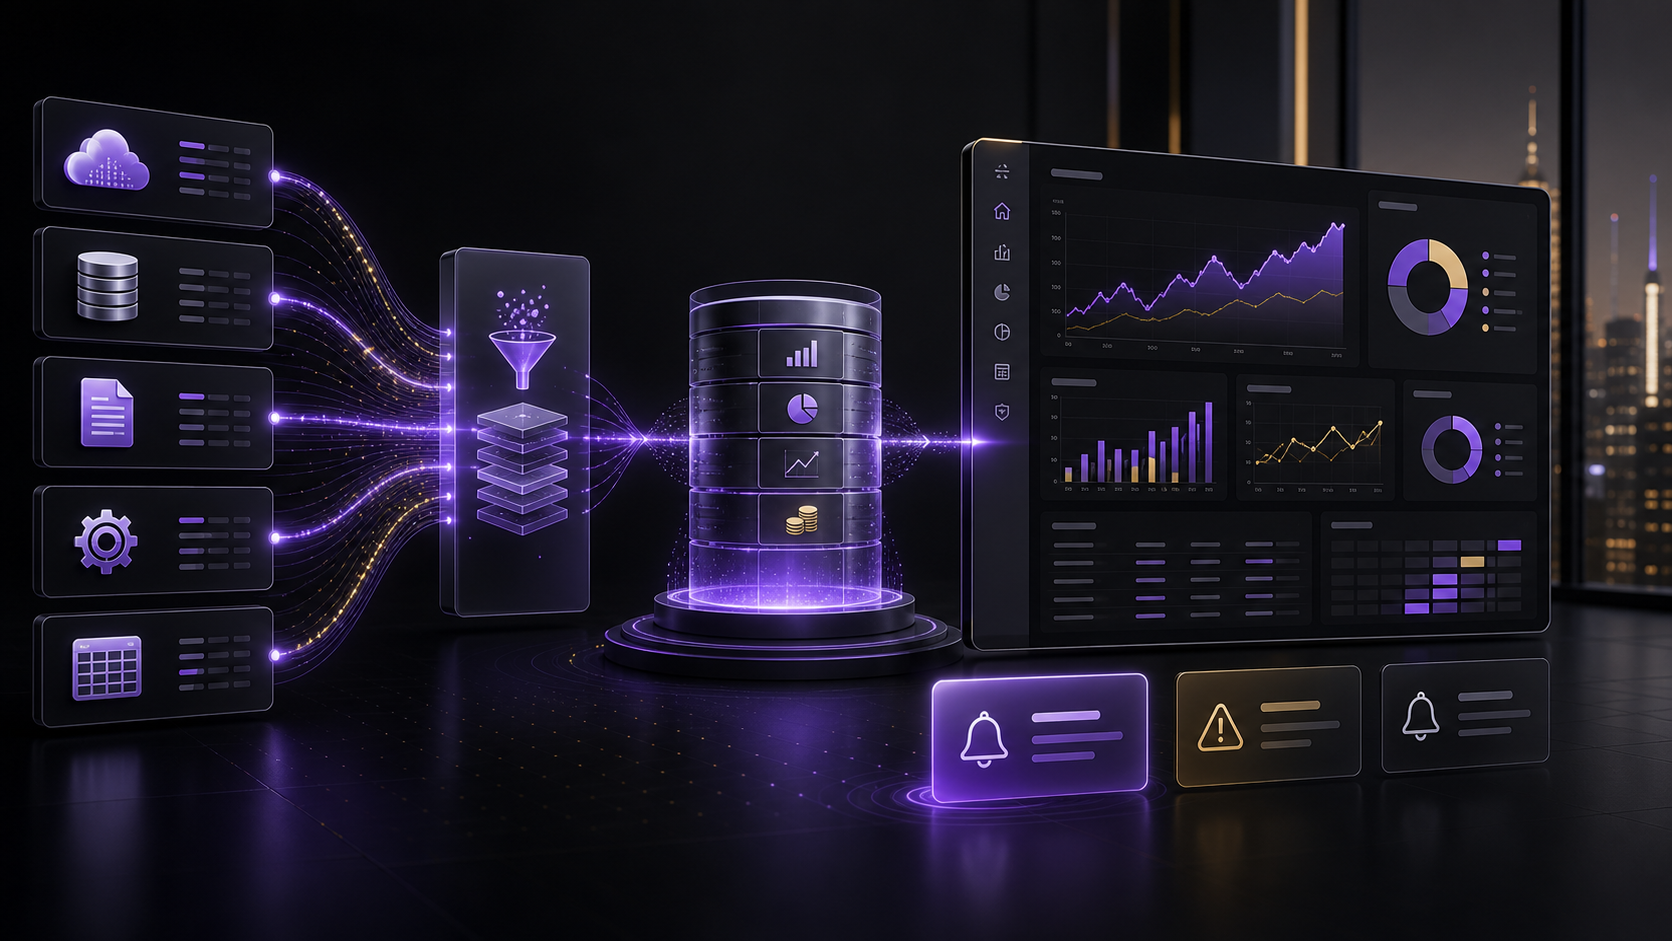
Live, interactive financial dashboards pulling from all your data sources — zero manual updates. Connect your accounting software, bank feeds, and ERP to deliver real-time P&L, cash flow, budget vs actuals, and KPI dashboards that refresh automatically and send weekly CFO-ready executive reports.
A real-time financial analytics platform that connects to your accounting software, bank feeds, and ERP to deliver live P&L, cash flow, budget vs actuals, and KPI dashboards. Automatically refreshes, highlights variances, and sends weekly CFO-ready executive reports — no manual spreadsheet work ever again.
Built on Python, Pandas, FastAPI, and Plotly Dash with PostgreSQL and Redis for real-time performance, the platform eliminates 40+ hours per month of manual financial reporting — giving your finance team instant visibility and your executives board-ready reports on autopilot.
40hrs Saved
Monthly Reporting
From multi-source data connectors to automated CFO reports — every step of your financial reporting process, automated end-to-end.
Connect QuickBooks, Xero, SAP, NetSuite, bank feeds, and ERP systems through a single unified pipeline — no manual exports or copy-paste between platforms.
Real-time profit & loss statements and cash flow visualizations that update automatically as new transactions flow in — no month-end spreadsheet marathons.
Compare budgeted figures against actuals in real time with variance percentages, trend lines, and department-level drill-downs — spot overspending the moment it happens.
Configurable thresholds trigger instant alerts when KPIs drift off target — revenue drops, cost overruns, or cash balance dips land in your inbox before they become problems.
Weekly executive summaries with key metrics, variance commentary, and forward-looking cash projections — generated and distributed automatically to stakeholders.
Drag-and-drop dashboard builder lets your team create custom views — by department, project, or entity — without writing a single line of code or waiting on IT.
A robust pipeline of data orchestration, real-time processing, and interactive visualization — engineered for production-grade financial reliability.
Stop spending hours on manual spreadsheet reporting. Let the platform handle the data while your finance team focuses on strategy and decision-making.
Every report, chart, and KPI is generated automatically from live data — your team never exports, formats, or reconciles a spreadsheet by hand again.
See your P&L, cash position, and KPIs the moment transactions post — no waiting for month-end closes or manual data pulls to know where the business stands.
Configurable thresholds flag budget overruns, revenue dips, and cash flow risks the instant they occur — catch problems before they escalate into crises.
Weekly CFO executive reports with commentary, trends, and projections are generated and sent automatically — board meetings never start with a reporting scramble again.
A streamlined pipeline that connects your financial systems and produces live, interactive dashboards with automated reporting — no manual maintenance required.
Link your accounting software, bank feeds, and ERP through secure API connectors — credentials are encrypted and data flows in continuously without manual intervention.
Use the drag-and-drop builder to create P&L, cash flow, budget vs actuals, and KPI dashboards tailored to your business — or start from pre-built templates and customize.
Configure variance thresholds, KPI targets, and alert routing — the system monitors your metrics continuously and notifies the right people the moment something drifts.
Dashboards refresh in real time and weekly CFO executive reports are generated and emailed to stakeholders automatically — the system runs itself once configured.
QuickBooks, Xero, SAP, NetSuite, Zoho Books, Tally, and any system with an API endpoint. We configure the connectors during deployment so data flows in continuously without manual exports.
Yes. The platform connects to bank feeds via Plaid and direct bank APIs — transactions appear on your dashboards within minutes of posting, giving you a real-time cash position at all times.
Dashboards refresh in real time as new data flows in from connected sources. For systems with slower sync cycles, you can configure refresh intervals down to every few minutes — no manual refresh required.
Absolutely. The drag-and-drop builder lets you define custom KPIs, build department-specific views, and create entity-level rollups — all without writing code or waiting on IT support.
Yes. Weekly executive reports with key metrics, variance commentary, and cash projections are generated and emailed to your configured stakeholder list on a schedule — board-ready, every time, with zero manual effort.
Book a consultation and see how a Financial Analytics Dashboard can eliminate 40+ hours of manual reporting every month — with real-time visibility and board-ready reports on autopilot.